Decomposing the AI Value Chain in the Agentic Era
From Model Labs and Nvidia to TSMC, Memory, and Power Infrastructure
Executive Summary
I want to be clear from the start about what is SemiAnalysis’s argument and what is my own extension of it.
The starting point is the SemiAnalysis essay “AI Value Capture - The Shift To Model Labs”. The piece argues that in 2026 the location of AI value capture has shifted from “how many GPUs you can deploy” to “models that produce high-economic-value tokens, plus the entire system that runs them”. I find this convincing.
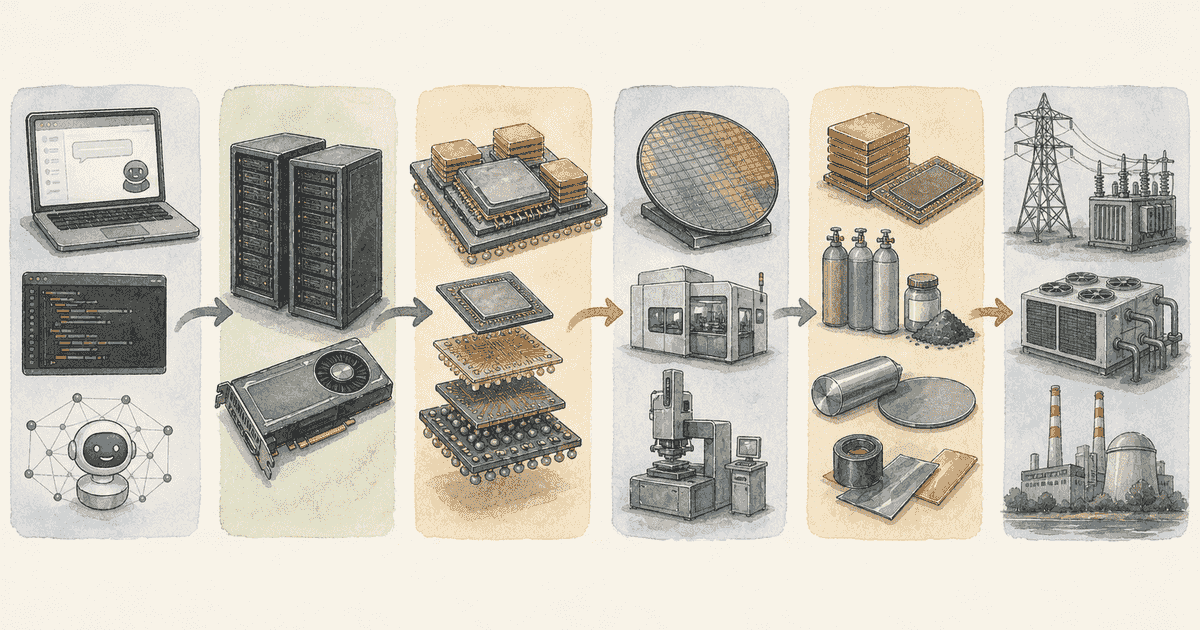
What this piece adds is the original hypothesis that the value does not stop at the model labs. It propagates stepwise upstream into NVIDIA’s racks and networking, TSMC’s leading-edge nodes and advanced packaging, HBM and SOCAMM, equipment, and power, cooling, and construction. This is an inference, but multiple pieces of it are already visible in primary data.
On the model-lab side, Anthropic’s pricing page shows large reductions for top-tier models, while the company emphasizes performance gains in coding and high-economic-value knowledge work. Anthropic also explicitly notes that token consumption itself can rise as the model spends more time thinking. So even with per-token prices falling, if more tokens are used per task and the user gets more ROI, model-lab gross margin can rise. This is consistent with Reuters reporting Anthropic’s annualized revenue above $3B and the strong observed demand for Claude Code.
On the size of that margin improvement, SemiAnalysis goes further and estimates Anthropic’s inference gross margin has gone from roughly 38% to 70%+, based on its own model. This is not Anthropic’s own disclosure and external verification is limited. The subgraphs in this piece use that figure as a proxy for the destination of the path.
NVIDIA remains the most important system-level price setter. FY2026 revenue was $215.9B, full-year gross margin 71.1%, and Q4 gross margin 75.0%. The annual report frames the transition from Hopper-centric HGX to Blackwell “full-scale datacenter solutions” as a margin headwind, yet the gross margin remains at this level. Customers are paying not for a GPU die but for a “system” that includes networking, software, supply assurance, and time-to-deployment — that is the natural reading.
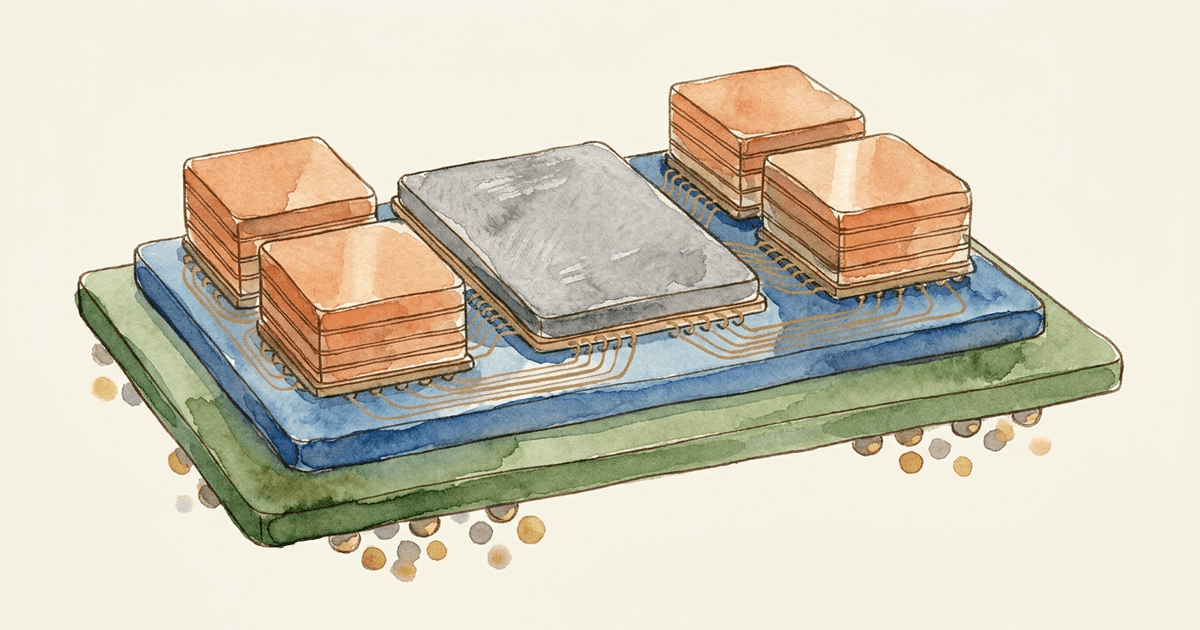
The main place this piece extends SemiAnalysis is on SOCAMM. SemiAnalysis argues that “Rubin/SOCAMM gives Nvidia new pricing levers.” This piece extends that argument into upstream supply constraints and the redistribution of profit pools. Samsung Electronics’s Q1 2026 results disclosed mass production sales of HBM4 and SOCAMM2 for NVIDIA Vera Rubin, and projected that agentic AI will accelerate demand growth in H2. Micron positions SOCAMM as its “flagship modular low-power memory for AI data centers.” SOCAMM is no longer a concept — it is already shipping into the Rubin generation. SemiAnalysis’s specific margin estimates for SOCAMM cannot be fully verified externally, but the existence of a modular BOM that can carry differentiated pricing is confirmed.
Upstream propagation is also visible. TSMC posted 2025 gross margin of 59.9%, guided 2026 CapEx to $52–56B, and named 2nm/3nm and advanced packaging as investment priorities. The company also explicitly says “the value customers find is reflected in our pricing.” On the Q1 2026 call, TSMC characterized advanced packaging capacity as “very tight,” with large CoWoS as the primary supply and CoPoS at pilot-line stage with mass production several years out. Tightness in HBM and packaging is the contact point where some of NVIDIA’s and the model labs’ excess profits flow upstream.
Memory is no longer “an AI accessory part.” Micron’s FY26 Q2 showed gross margin of 74.4% and Q3 guidance near 81%, with Cloud Memory and Core Data Center segments both at 74%. Samsung’s DS division posted 53.7T won of operating profit in Q1 2026, and SK hynix told Reuters that AI memory demand exceeds production capacity. HBM/SOCAMM/high-performance DRAM in 2026 is no longer a commodity but a strategically scarce, high-margin component.
Finally, the advantage in power, cooling, and construction is more likely to strengthen than fade. GE Vernova won $2.4B of data-center electrification orders in Q1 2026 alone, exceeding the prior full year. Vertiv grew Q1 sales 30% with adjusted operating margin of 20.8% and emphasized extreme density, gigawatt-scale expansion, and liquid cooling. Eaton talked about >1MW rack densities and a “grid-to-chip” modular approach, plus switchgear capacity expansion. Schneider Electric named data centers as the main driver of its 11.2% Q1 organic growth. The 2026 AI value chain — even when the trigger is the model-lab value shift SemiAnalysis describes — is spreading its profit pool, in the listed markets where investors can act, into memory, packaging, power equipment, cooling, and construction.
SemiAnalysis’s Argument and the Original Hypothesis Here
I will summarize SemiAnalysis’s argument first and then state the original hypothesis this piece adds, separately.
What SemiAnalysis argues (summary)
The points of SemiAnalysis’s piece, as I read it, are roughly the following:
- 2023–2025: the supply side of AI infrastructure (especially GPUs) captured the most value
- 2026 onward: with Agentic AI in production, “token economic value” is what matters, not “token unit price,” and value capture moves toward the model labs
- Price differentiation on the GPU die alone draws antitrust attention, but peripheral BOM such as memory and networking is easier to differentiate on price
- SOCAMM in the Rubin generation is therefore a new pricing lever
- Anthropic’s inference gross margin is estimated to have improved from 38% to 70%+ (SemiAnalysis own model)
- Claude Code shows an input/output ratio of about 300:1 and cache hit rate over 90%, so effective blended unit cost is much lower
- Software optimization alone (wideEP / disagg / MTP, etc.) can take the same B300 from 1k to 14k tok/s/GPU (InferenceX bench)
- Capex/W from GB300 ($37.4) to VR ($38.1) is nearly flat — SemiAnalysis reads this as Nvidia not yet fully extracting value
- SOCAMM contract price is estimated at ~$8/GB in Q1 2026 and may rise to >$13/GB by end-2026; Nvidia could potentially carry ~60% margin on SOCAMM
- VR NVL72 GPU rental price band: lower bound ~$4.92/hr, upper bound ~$12.25/hr, with Neocloud IRR in the 15.6% – 38% range
- Premium tier “Mythos” (5x normal Opus price) has room to be accepted by the most active enterprise users
These are SemiAnalysis’s estimates, often based on its own internal models, and are not fully verifiable from outside. The subgraphs and triple table below reference these numbers as SemiAnalysis-derived, and I want to emphasize upfront that they are not independently calculated by me.
Original hypothesis here
What this piece argues, as its own contribution, is one rung further upstream.
If Agentic AI raises token economic value and both model labs and NVIDIA preserve or strengthen their pricing power, then the excess profit must flow back into the physical layers where supply remains constrained.
Concretely: leading-edge nodes; CoWoS / SoIC / CoPoS advanced packaging; HBM / SOCAMM / high-performance DRAM; lithography, deposition, etch, and inspection equipment; ABF substrates; further into transformers, switchgear, gas turbines, liquid cooling, and data-center construction. This is not the loose claim “AI demand is big, so upstream rises.” It is the more specific claim that the largest investment opportunities arise where the ability to raise prices and the difficulty of expanding capacity (quarters to years) overlap.
Separating fact from hypothesis
To organize:
- Verifiable facts: model labs’ Agentic product expansion, NVIDIA’s high gross margin, TSMC’s tight advanced packaging, the unusually high profitability of memory makers, equipment vendors’ growing HBM and packaging exposure, GE Vernova / Vertiv / Eaton order and profit expansion
- SemiAnalysis estimates: specific Anthropic inference margin level, SOCAMM price and margin structure, capex/W reading, rental price band, Mythos uptake, scope of TSMC’s pricing room
- Hypotheses this piece adds: how much SOCAMM and Rubin actually move NVIDIA’s margin, whether Neoclouds can preserve middle-layer margin while raising capital, how much of high agent value the labs can monetize
Causal Map: Overview
The figure below is my synthesis, but each node rests on the primary sources cited above and on SemiAnalysis’s argument. I first show the conceptual overview, and then four detailed subgraphs anchored to an investment-theme causal model I maintain separately.
flowchart TD
    A["Agentic AI in production"] --> B["Higher ROI per task"]
    A --> C["More tokens consumed per task"]
    B --> D["Higher willingness to pay<br/>for top closed models"]
    C --> E["Total inference compute demand ↑"]
    D --> F["Model-lab revenue per task ↑"]
    E --> F
    F --> G["NVIDIA system demand ↑"]
    G --> H["Rack ASP, networking,<br/>memory implementation value ↑"]
    H --> I["Rubin/SOCAMM/HBM<br/>added-value expansion"]
    I --> J["TSMC leading-edge nodes<br/>and advanced packaging ↑"]
    J --> K["Equipment, substrate, OSAT ↑"]
    K --> L["Power, cooling,<br/>construction, grid ↑"]

    M["Counterargument:<br/>open models / ASIC / efficiency"] -.-> D
    M -.-> G
    N["Counterargument:<br/>regulation / export control / funding"] -.-> G
    N -.-> J
    N -.-> L

    classDef primary fill:#e1f5fe,stroke:#0288d1
    classDef counter fill:#ffebee,stroke:#c62828
    class A,B,C,D,E,F,G,H,I,J,K,L primary
    class M,N counter
The most important point in this map is that cost reductions and demand increases happen at the same time. Anthropic lowers top-tier model prices, but at higher effort levels and longer thinking the total token count can increase. Agentic AI raises revenue and profit when “task value of finishing one job” and “total token demand” rise faster than “price per million tokens” falls. That is the mechanism that ties model labs through semiconductors all the way to power into a single cycle.
Causal Map: Detailed Subgraphs (Anchored to an Investment-Theme Causal Model)
The next four diagrams are drawn from an investment-theme causal model I maintain separately (a structure where each theme carries nodes / edges / event-rules in CSV). The four subgraphs cover the parts of that model that map to the points in this piece.
Important note on attribution: in Subgraphs 1 and 2 below, the specific numbers (Anthropic inference margin 38%→70%+, Claude Code 300:1 / 90% hit, SOCAMM contract price $8–$13/GB, NVIDIA memory-layer assumed margin 60%, capex/W $37.4→$38.1, rental price band $4.92–$12.25/hr, Neocloud IRR 15.6%–38%, etc.) are all SemiAnalysis estimates from its own internal model, not numbers calculated by me. Subgraphs 3 and 4 (hardware and power cascades) are structured from primary disclosures and process-engineering knowledge, not from SemiAnalysis estimates, so they reflect physical dependencies rather than estimates.
How to Read the Subgraphs (Notation)
Three pieces of notation are worth defining upfront before reading the subgraphs.
- Node IDs (A1, A2, …, B1, …, C1, …, D1, …): each box in a diagram is labeled with a short ID. When the body text refers to “(A1→A7),” it means the arrow from A1 (Agentic AI adoption) to A7 (token market clearing price) in Subgraph 1. Subgraph 1 uses A, Subgraph 2 uses B, Subgraph 3 uses C, Subgraph 4 uses D.
- direction (positive / negative): the sign of how the source node moves the destination node. positive means “source up → destination up” (same direction). negative means “source up → destination down” (opposite direction). For example, “cost down → margin up” is
negative(source ↓ → destination ↑, opposite directions). - confidence (0.5–0.95): how reliable the causal relationship is, on a 0–1 scale. 0.9+ is textbook-level certain (e.g., HBM adoption → TSV count). 0.7–0.85 is a strong correlation that holds in most cases. 0.5–0.65 is conditional — holds in some scenarios, not others. Each edge in this piece is annotated as e.g. “positive 0.8” or “negative 0.7”, combining direction and confidence.
To be transparent: these confidence numbers are not derived from Bayesian inference, regression coefficients, or any other statistical method. They are qualitative scores I assigned as the model author, calibrated against papers, primary disclosures, and the historical track record of similar relationships. Treat them as a proxy for intuitive conviction. Use them more for the relative ordering of edges (which relationships are robust vs conditional) than for the absolute level. Values are revised whenever new primary evidence emerges.
Subgraph 1: The Economics of Agentic AI (Inference Cost, Market Price, and Margin)
This subgraph shows how Agentic AI in production propagates into model-lab inference gross margin. The path SemiAnalysis estimates (Anthropic inference margin 38% → 70%+) is reachable because price increases and cost reductions push from both sides at once. The numbers in this figure (300:1, 90% hit, wideEP/disagg/MTP gains) are SemiAnalysis estimates.
flowchart TD
    A1["A1: Agentic AI adoption"]
    A2["A2: Agentic workload I/O ratio<br/>+ cache hit rate<br/>(SemiAnalysis: Claude Code 300:1 / 90% hit)"]
    A3["A3: Inference SW optimization<br/>(wideEP / disagg / MTP)"]
    A4["A4: KV cache compression diffusion<br/>(DeepSeek V4 CSA/HCA)"]
    A5["A5: Total inference workload<br/>(Jevons paradox downstream)"]
    A6["A6: Token production cost"]
    A7["A7: Token market clearing price<br/>(value-based ceiling)"]
    A8["A8: Closed frontier model<br/>practical superiority"]
    A9["A9: AI lab pricing power"]
    A10["A10: AI lab inference gross margin<br/>(SemiAnalysis estimate: Anthropic 38%→70%+)"]
    A11["A11: Premium tier model demand<br/>(SemiAnalysis: Mythos / Opus fast)"]

    A1 -->|positive 0.8| A2
    A1 -->|positive 0.8| A5
    A1 -->|positive 0.8| A7
    A2 -->|negative 0.7| A6
    A3 -->|negative 0.7| A6
    A3 -->|positive 0.5| A4
    A4 -->|positive 0.7| A5
    A6 -->|negative 0.8| A10
    A7 -->|positive 0.7| A10
    A8 -->|positive 0.6| A9
    A9 -->|positive 0.5| A11
    A11 -->|positive 0.5| A7

    classDef demand fill:#e1f5fe,stroke:#0288d1
    classDef cost fill:#fff3e0,stroke:#ef6c00
    classDef price fill:#f3e5f5,stroke:#8e24aa
    classDef margin fill:#e8f5e9,stroke:#388e3c
    class A1,A2,A5 demand
    class A3,A4,A6 cost
    class A7,A8,A9,A11 price
    class A10 margin
What this shows is that Agentic AI adoption (A1) drives three paths at the same time:
- (a) Price-up path (A1 → A7, positive): Agentic AI in production raises the token market clearing price (A7).
- (b) Cost-down path (A1 → A2, positive) → (A2 → A6, negative): Agentic AI skews the workload toward input-heavy with high cache hit rate (A2), and that skew lowers per-token production cost (A6). Note A2→A6 is negative — A2 going up makes A6 go down.
- (c) Demand-up path (A1 → A5, positive): total inference workload (A5) also rises.
Two edges enter the margin (A10):
- A7 → A10 (positive): when price (A7) goes up, margin (A10) goes up.
- A6 → A10 (negative): when cost (A6) goes down, margin (A10) goes up. The negative direction means A6 ↓ → A10 ↑.
So A10 receives upward pressure from both sides at once — from the price side (A7→A10) and from the cost side (A6→A10). The 38% → 70%+ inference margin improvement that SemiAnalysis estimates for Anthropic fits this construction naturally as a proxy for the destination.
Subgraph 2: NVIDIA’s Pricing Levers and the Role of SOCAMM
This subgraph expresses SemiAnalysis’s argument (“NVIDIA cannot easily raise GPU body prices, but it can differentiate price on peripheral BOM such as memory and networking”) in the internal model’s node IDs. The numbers in the figure — SOCAMM contract price ($8 → $13/GB), assumed margin 60%, capex/W ($37.4 → $38.1), rental band ($4.92 – $12.25/hr), Neocloud IRR (15.6% – 38%) — are all SemiAnalysis estimates.
flowchart TD
B1["B1: SOCAMM contract price<br/>(SemiAnalysis: $8/GB Q1 → $13/GB end-2026)"]
B2["B2: NVIDIA memory-layer pricing power<br/>(SemiAnalysis: SOCAMM ~60% margin)"]
B3["B3: NVIDIA network price segmentation<br/>(SemiAnalysis: SN5610 Neocloud vs HSC 2x)"]
B4["B4: NVIDIA GPU pricing restraint<br/>(antitrust-driven)"]
B5["B5: VR NVL72 capex per watt<br/>(SemiAnalysis: GB300 $37.4 → VR $38.1)"]
B6["B6: GB300 → VR FLOP/$ gain<br/>(SemiAnalysis: ~60% customer-side cost drop)"]
B7["B7: VR NVL72 GPU rental price band<br/>(SemiAnalysis: $4.92 – $12.25/hr/GPU)"]
B8["B8: Neocloud IRR band<br/>(SemiAnalysis: 15.6% – 38%)"]
B9["B9: Nvidia Rubin/H200<br/>generation cadence"]
B1 -->|positive 0.7| B2
B2 -->|positive 0.6| B5
B3 -->|positive 0.4| B2
B4 -.->|negative 0.5| B5
B6 -->|positive 0.7| B7
B5 -->|positive 0.6| B7
B7 -->|positive 0.7| B8
B2 -->|positive 0.5| B9
classDef lever fill:#f3e5f5,stroke:#8e24aa
classDef restraint fill:#ffebee,stroke:#c62828
classDef econ fill:#e1f5fe,stroke:#0288d1
classDef return fill:#e8f5e9,stroke:#388e3c
class B1,B2,B3 lever
class B4 restraint
class B5,B6,B7,B9 econ
class B8 returnRead this subgraph from left (B1–B4: pricing levers) to right (B5–B9: system economics and returns).
Pricing-lever side (B1–B4)
- B4 (GPU pricing restraint) → B5 (capex/W), negative: antitrust risk keeps NVIDIA from marking up the GPU die freely, so capex/W cannot rise much (drawn dashed, confidence 0.5 — “conditional”).
- Instead NVIDIA uses two “sibling levers” of price differentiation: B1 (SOCAMM contract price) → B2 (memory-layer pricing power), positive 0.7 and B3 (network segmentation) → B2, positive 0.4. SemiAnalysis sees these as the substitutes for GPU-die markup.
- The puzzling near-flat capex/W from GB300 ($37.4) to Vera Rubin ($38.1) is best explained by B4 holding down direct GPU markup, with B1 and B3 carrying the differentiation instead.
System-economics and return side (B5–B9)
This is the part the body text had not previously covered. VR Rubin’s performance jump from GB300 also improves the economics customers feel, and that drives the B6 → B7 → B8 chain.
- B6 (GB300→VR FLOP/$ gain: ~60% customer-side cost drop) → B7 (rental price band), positive 0.7: because VR delivers more FLOPs per dollar, Neoclouds can raise prices and still leave the customer better off. The upper bound (value-based ceiling) of the rental band — $12.25/hr — opens up.
- B5 (capex/W) → B7, positive 0.6: a higher capex/W raises Neocloud depreciation, which lifts the lower bound (cost-based floor = $4.92/hr) needed to sustain IRR.
- B7 (rental band: $4.92–$12.25/hr) → B8 (Neocloud IRR band: 15.6%–38%), positive 0.7: when Neoclouds can capture the upper end of the rental band, the IRR upper bound (38%) becomes reachable.
- B2 (NVIDIA memory-layer pricing power) → B9 (Rubin/H200 generation cadence), positive 0.5: high margins on memory give NVIDIA the funding to maintain or accelerate the Rubin / Rubin Ultra roadmap, which keeps the wheel turning.
In summary, the value of VR (anchored at B6) lifts both B7 (rental price) and B8 (Neocloud IRR) simultaneously, and the resulting system leaves room for NVIDIA, Neoclouds, and customers all to benefit. SemiAnalysis points out that NVIDIA has not yet fully extracted this value, so further price increases are still on the table.
Subgraph 3: Hardware Demand Cascade (GPU → HBM → Packaging → Equipment)
GPU shipment volume propagates almost mechanically into HBM, TSV, SLT testing, etch equipment, and ABF substrates. Edge confidences are high (0.85–0.95) because these relationships reflect physical process dependencies. The numbers here are from the internal model; they are not SemiAnalysis estimates but structured from each company’s primary disclosures and process-engineering knowledge.
flowchart TD
    C1["C1: Hyperscaler capex"]
    C2["C2: AI data-center buildout speed"]
    C3["C3: GPU/AI accelerator shipments"]
    C4["C4: HBM4 adoption volume"]
    C5["C5: HBM4 TSV wiring complexity<br/>(4x TSV count vs HBM3E)"]
    C6["C6: HBM SLT test time"]
    C7["C7: HBM SLT tester demand<br/>(Advantest exposure)"]
    C8["C8: Front-end etch equipment demand<br/>(LRCX / TEL)"]
    C9["C9: ABF substrate demand<br/>(Ibiden)"]
    C10["C10: ABF film demand<br/>(Ajinomoto)"]
    C11["C11: TSMC leading-edge capacity<br/>(N3/N4 remaining)"]
    C12["C12: Compute die enlargement cycle"]
    C13["C13: TSMC CoWoS-L effective capacity"]

    C1 -->|positive 0.9| C2
    C2 -->|positive 0.9| C3
    C3 -->|positive 0.95| C4
    C4 -->|positive 0.95| C5
    C5 -->|positive 0.9| C6
    C6 -->|positive 0.95| C7
    C5 -->|positive 0.8| C8
    C3 -->|positive 0.9| C9
    C9 -->|positive 0.95| C10
    C3 -->|negative 0.8| C11
    C3 -->|positive 0.75| C12
    C12 -->|negative 0.6| C13

    classDef macro fill:#e1f5fe,stroke:#0288d1
    classDef hbm fill:#f3e5f5,stroke:#8e24aa
    classDef equip fill:#fff3e0,stroke:#ef6c00
    classDef bottleneck fill:#ffebee,stroke:#c62828
    class C1,C2,C3 macro
    class C4,C5,C6 hbm
    class C7,C8,C9,C10 equip
    class C11,C12,C13 bottleneck
The fact this subgraph captures is that almost every downstream process indicator is fixed mechanically from GPU shipments (C3) at confidence 0.85–0.95. HBM4 has 4x the TSV count of HBM3E (C4→C5), SLT test time stretches in proportion (C5→C6), and SLT tester demand is therefore lifted directly (C6→C7). All three relationships are hard to avoid by process design. At the same time, GPU mass production negatively consumes TSMC leading-edge capacity (C11) and CoWoS-L capacity (C13). That is the physical basis for upstream supply tightness and for the migration of pricing power upstream.
Subgraph 4: The Data-Center Power, Cooling, and Grid Cascade
This subgraph covers the data-center power, cooling, and grid side. It traces the chain from data-center construction pipeline to power demand, grid-interconnection wait, gas turbines, and liquid cooling, modeled from each company’s primary disclosures.
flowchart TD
    D1["D1: Global AI capex commitment"]
    D2["D2: DC construction pipeline"]
    D3["D3: DC power demand (MW)"]
    D4["D4: DC cooling system demand"]
    D5["D5: DC grid interconnection lead time"]
    D6["D6: Power grid capex<br/>(GE Vernova / Eaton exposure)"]
    D7["D7: Liquid cooling market<br/>(Vertiv exposure)"]
    D8["D8: DC on-site gas turbine adoption"]
    D9["D9: Gas turbine EPC demand"]
    D10["D10: DC stationary BESS market"]
    D11["D11: DC site-selection constraint<br/>(scatter to grid-spare regions)"]
    D12["D12: AI lab self-funded capex<br/>(retained earnings from high GM)"]

    D12 -->|positive 0.7| D1
    D1 -->|positive 0.85| D2
    D2 -->|positive 0.9| D3
    D2 -->|positive 0.85| D4
    D2 -->|positive 0.85| D5
    D3 -->|positive 0.8| D6
    D4 -->|positive 0.75| D7
    D5 -->|positive 0.8| D8
    D5 -->|positive 0.75| D10
    D5 -->|positive 0.7| D11
    D8 -->|positive 0.85| D9

    classDef driver fill:#e8f5e9,stroke:#388e3c
    classDef build fill:#e1f5fe,stroke:#0288d1
    classDef power fill:#fff3e0,stroke:#ef6c00
    classDef bottleneck fill:#ffebee,stroke:#c62828
    class D1,D12 driver
    class D2,D3,D4 build
    class D6,D7,D9,D10 power
    class D5,D8,D11 bottleneck
The notable feature is that D5 (grid interconnection lead time) is a hub that triggers D8 (on-site gas turbines), D10 (BESS), and D11 (site-selection constraint) simultaneously. The longer the grid wait, the more data-center operators must turn to gas turbine self-generation and battery storage. GE Vernova’s surging backlog, Eaton’s switchgear capacity expansion, and Vertiv’s liquid-cooling growth all sit downstream of branches that originate at D5.
A second point worth noting is that D12 (AI lab self-funded capex) → D1 (global AI capex), positive 0.7 is the edge that ties Subgraph 1 to Subgraph 4. Concretely, the loop runs like this:
- In Subgraph 1, AI-lab inference margin (A10) rises (SemiAnalysis estimates 38% → 70%+).
- That high margin accumulates as retained earnings (self-funded capital) inside the AI labs (D12).
- Those retained earnings sustain AI capex (D1) without leaning on the external capital markets.
- That capex flows downstream into the DC construction pipeline (D2), then into power, cooling, and grid demand.
So the profit that piles up in the model labs in Subgraph 1 becomes (without going through equity or debt issuance) the fuel for global AI capex in Subgraph 4. The loop, however, hinges on the high margin (A10) that SemiAnalysis estimates actually being there. If that assumption breaks, the whole loop slows.
Key Causal Triples (Selected, from Pack edges.csv)
From the four subgraphs above, 18 triples that directly support this piece’s argument are extracted below. Direction and confidence are reported as recorded in the internal model. Triples #1–#9 reference price, margin, and cost numbers that all rely on SemiAnalysis estimates (not independently verified). Triples #10–#18 are based on process and physical dependencies and are more robust.
| # | Source node | relation | Destination node | direction | conf. | Interpretation |
|---|---|---|---|---|---|---|
| 1 | agentic_ai_practical_adoption | value_realization | token_market_clearing_price | positive | 0.8 | Agentic adoption realizes the price of knowledge work, lifting market clearing price (SemiAnalysis) |
| 2 | agentic_workload_input_heavy | cache_hit_economics | token_production_cost | negative | 0.7 | 300:1 input ratio + 90% cache hit collapses effective blended unit cost (SemiAnalysis) |
| 3 | inference_software_optimization | sw_throughput_gain | token_production_cost | negative | 0.7 | wideEP/disagg/MTP push GPU throughput from 1k → 14k tok/s, sharp HW amortization drop (SemiAnalysis InferenceX) |
| 4 | token_production_cost | cost_to_margin | ai_lab_inference_gross_margin | negative | 0.8 | Cost reduction is the primary lever of AI-lab inference margin expansion (SemiAnalysis-estimated destination) |
| 5 | token_market_clearing_price | price_to_margin | ai_lab_inference_gross_margin | positive | 0.7 | Price increase also contributes directly to margin improvement (SemiAnalysis) |
| 6 | ai_lab_inference_gross_margin | self_funded_capex | macro_ai_capex_global | positive | 0.5 | High margin enables self-funded capex, lifting overall AI capex |
| 7 | socamm_contract_price | memory_lever_realization | nvidia_memory_pricing_power | positive | 0.7 | $8 → $13/GB confirms memory layer can be priced as an independent line item (SemiAnalysis) |
| 8 | nvidia_gpu_pricing_restraint | gpu_restraint_caps_capex | vr_nvl72_capex_per_watt | negative | 0.5 | Restraint on GPU markup limits the rise in capex/W (SemiAnalysis) |
| 9 | nvidia_network_segmentation | segmentation_siblings | nvidia_memory_pricing_power | positive | 0.4 | SN5610 and SOCAMM are siblings in the same “differentiation lever” strategy (SemiAnalysis) |
| 10 | macro_datacenter_buildout | gpu_procurement | asic_gpu_unit_volume | positive | 0.9 | Faster DC buildout directly raises GPU procurement volume |
| 11 | asic_gpu_unit_volume | direct_memory_demand | hbm_hbm4_adoption_volume | positive | 0.95 | Each GPU uses 6–12 HBM stacks; the most upstream driver |
| 12 | hbm_hbm4_adoption_volume | tsv_count_4x | hbm_tsv_complexity | positive | 0.95 | HBM4 has 4x the TSV count of HBM3E; large complexity jump |
| 13 | hbm_slt_test_time | tester_volume | equip_hbm_slt_demand | positive | 0.95 | Longer test time → more SLT testers procured (Advantest beneficiary) |
| 14 | asic_gpu_unit_volume | flipchip_substrate | pack_abf_substrate_demand | positive | 0.9 | AI GPUs use large flip-chip packages, lifting ABF substrate demand directly |
| 15 | asic_gpu_unit_volume | capacity_consumption | asic_tsmc_leading_capacity | negative | 0.8 | GPU mass production consumes TSMC leading-edge capacity, tightening remaining capacity |
| 16 | dc_construction_pipeline | build_to_grid_queue | dc_grid_interconnection_lead_time | positive | 0.85 | DC buildout extends grid interconnection wait |
| 17 | dc_grid_interconnection_lead_time | queue_to_onsite_gen | gas_turbine_onsite_generation | positive | 0.8 | The longer the grid wait, the more shifts to on-site generation |
| 18 | dc_cooling_system_demand | cooling_to_liquid | liquid_cooling_market | positive | 0.75 | Cooling demand growth lands primarily in liquid cooling |
Layer-by-Layer Analysis
Model Labs
The first thing to confirm when treating Agentic AI as an investment theme is whether model performance is actually translating into pricing power. On a conservative read, the answer is close to yes. Anthropic priced Opus 4.7 at $5/MTok input and $25/MTok output, a sharp drop from the prior top model Opus 4.1 ($15 / $75), while emphasizing improvement on coding and high-economic-value knowledge work. Claude Code raised the default effort level to xhigh to support longer tasks. Performance gains and per-token price reductions are happening at the same time.
Anthropic itself notes that the Opus 4.7 update can convert the same input into 1.0–1.35x more tokens, and that in agent settings later turns produce more inference and more output tokens. So while the “price per token” goes down, the “bill per finished job” does not — and may rise. This structure becomes easier to monetize as the market shifts away from flat-rate pricing toward usage- or task-based pricing. Reuters reports Anthropic’s annualized revenue passed $3B, roughly a 4x expansion since the start of the year — consistent with the SemiAnalysis claim that Claude Code is pulling enterprise usage up.
Going further, SemiAnalysis estimates from its own model that Anthropic’s inference gross margin has improved from 38% to 70%+. This piece treats that estimate as plausible and uses it as a frame, but it is not Anthropic’s own disclosure. Similarly, SemiAnalysis sees room for the Premium tier “Mythos” (5x normal Opus price) to be accepted by the most active enterprise users.
OpenAI’s Codex is positioned as a “command center for agentic coding,” advertising parallel agents that compress weeks of work into days. Google’s Gemini Code Assist covers the full development lifecycle. The market is shifting from “chat” to “getting work done,” and payment for high-quality models is increasingly for “labor saved” rather than “tokens consumed”. That is what this piece means by rising token economic value.
GPUs and the System
NVIDIA’s value capture can no longer be measured by the GPU die alone. FY2026 revenue of $215.9B, full-year gross margin of 71.1%, and Q4 gross margin of 75.0% show that the company still holds substantial pricing power. The annual report attributes margin headwinds to the Blackwell transition and a $4.5B inventory and purchase obligation charge on H20-related products. Even with those, gross margin remains at this level — so customers are paying not for a GPU chip but for system, software, supply assurance, and time saved.
On networking, Spectrum-X claims 1.6x network performance for AI clouds and supports rack-scale configurations of up to 256 GPUs per rack. SN5610 is a 64-port 800GbE, 51.2Tb/s class switch. Networking is therefore not an accessory but a revenue lever that determines AI-factory performance and utilization. SemiAnalysis claims that “networking is already used for price discrimination” (giving SN5610 Neocloud price at roughly 2x hyperscaler price as an example); at minimum, the existence of a differentiation possibility in the product line is consistent with that claim.
On Rubin/SOCAMM, fact and hypothesis must be separated cleanly:
- Facts: Samsung announced mass production of HBM4 and SOCAMM2 for Vera Rubin; Micron positions SOCAMM as a flagship AI data-center memory; Nebius signed a long-term agreement with Meta based on a large Vera Rubin deployment
- SemiAnalysis estimates: SOCAMM contract price ~$8/GB Q1 2026 → $13/GB end-2026, NVIDIA carries ~60% margin on SOCAMM, capex/W GB300 $37.4 → VR $38.1
- The hypothesis this piece adopts: SOCAMM modularity may give NVIDIA room for rack-level price discrimination
The internal SOCAMM margin structure cannot be fully verified externally. What is verifiable is that the Rubin generation has additional BOM that can carry differentiated pricing.
Neocloud
Neoclouds — selling AI capacity between model labs and hyperscalers — are the hardest layer to evaluate in 2026. CoreWeave disclosed 2025 revenue of $5.13B, Adjusted EBITDA of $3.09B, and revenue backlog of $66.8B; in investor materials it targets long-term adjusted operating margin of 25–30%. If demand can be secured, Neoclouds also have meaningful operating leverage.
But Neoclouds are also the most capital-intensive layer. Reuters reports CoreWeave plans $30–35B of CapEx in 2026 with long-term debt above $14B. Nebius has a Meta agreement of up to $27B but realizing it requires a large Vera Rubin ramp and continued capital raising. Neocloud demand beta is high, but financial and customer-concentration risk are also extreme. From an investor perspective, Neoclouds are best framed not as “an NVIDIA substitute” but as “a high-leverage middle layer with large upside while AI demand persists.”
In SemiAnalysis’s framework (“One Chart to Rule Them All”), for VR NVL72 the Neocloud cost-based minimum rental is around $4.92/hr/GPU and the value-based ceiling is around $12.25/hr/GPU. The Neocloud IRR range is 15.6% (lower) to 38% (upper). SemiAnalysis sees NVIDIA as still having room to extract value from this gap. This piece uses those numbers as the relevant range.
Foundry and Advanced Packaging
TSMC is the upstream core that most reliably continues to take price across this value chain. The 2025 annual report shows total gross margin of 59.9%, annual CapEx of $40.9B, 2026 guidance of $52–56B, and investment priorities of 2nm/3nm and advanced packaging. The company explicitly says the value customers find is reflected in our pricing, indicating value-based pricing rather than pure volume. By 2025, 3nm reached 24% of revenue and the 7nm-and-below leading-edge mix climbed to 74% — making clear that AI is pulling the leading-edge mix up.
Packaging is even tighter. TSMC’s 1Q 2026 call described advanced packaging capacity as “very tight,” with cooperation from OSATs to support customer demand. Large CoWoS remains the primary supply for large-reticle products, while CoPoS sits at the pilot-line stage with mass production several years away. Even when NVIDIA and the model labs capture value, the physical quantity of AI systems that can actually be built is constrained by CoWoS / CoPoS / SoIC / substrates / thermal design. Among SemiAnalysis’s hypotheses, this is the location where upstream value propagation is most likely to occur.
SemiAnalysis (somewhat ironically) calls TSMC “the fairest and most just company in the world,” meaning that even in extreme demand TSMC does not maximize price, and that it has room to raise prices that customers would accept. This piece agrees with the direction, but finds SemiAnalysis’s own follow-up — that TSMC is more likely to use long-term contracts, capacity commitments, and prepayments rather than headline price increases — to be the more realistic read.
Memory
By 2026, memory has become the layer that has shifted most rapidly into “high-margin material with pricing power” in this value chain. Micron’s FY26 Q2 showed $23.86B of revenue, gross margin of 74.4%, and Q3 gross margin guidance near 81%, with Cloud Memory and Core Data Center segments both at 74%. These margins are exceptional for a memory vendor and indicate that AI memory has effectively become a strategic asset.
Samsung shows the same pattern. The DS division posted Q1 2026 revenue of 81.7T won and operating profit of 53.7T won — record sales and profit for the memory business. Samsung announced mass production sales of HBM4 and SOCAMM2 for Rubin and projected that agentic AI will accelerate server memory demand in H2 2026. SK hynix told Reuters that AI chip demand exceeds production capacity and that supply / price tightness will continue. The AI memory area can no longer be analyzed using the old cyclical commodity-DRAM frame.
Equipment and Materials
The equipment vendors are the most direct in acknowledging upstream propagation. ASML’s 2025 annual report describes strong demand, high prices, and supply/demand imbalance in AI logic and memory as drivers of equipment-market growth, and frames AI as the cause of the mix shift toward leading-edge logic and DRAM, requiring more EUV exposures. The weight of this statement is large: the equipment market mix itself is shifting toward higher value due to AI.
Applied Materials goes further: AI compute requires 3–4x the wafer starts per delivered bit in HBM DRAM compared to standard DRAM, and HBM stacks are growing from 12 layers to 16 and beyond 20, lifting both packaging and front-end. Applied also names HBM and 3D chiplet stacking as the fastest-growing advanced packaging areas in 2026. Lam Research guided 2026 advanced packaging revenue to grow more than 50%; KLA emphasized AI-infrastructure benefit across foundry/logic, memory, advanced packaging, and services. Tokyo Electron talked about FY2026 continuation of AI server-related leading-edge logic and DRAM/HBM investment, plus POR wins in advanced packaging.
Public information on materials is thinner, but substrates look quite promising. ASE Technology Holding told Reuters its 2026 advanced packaging revenue is expected to exceed $3.5B, and Ibiden announced a 500B-yen investment plan to expand high-performance IC package substrates for AI servers. Pure chemical materials and consumables disclose less, so this piece avoids strong investment claims there. But at minimum, substrates and OSATs around advanced packaging have officially disclosed that AI demand is arriving.
Power, Cooling, and Construction
In the end, an AI cluster is a physical facility that consumes power. GE Vernova reported Q1 2026 orders of $18.3B, backlog of $163B, and data-center electrification orders of $2.4B — exceeding the prior full year. Gas turbine backlog plus slot reservations are projected to reach at least 110GW by year-end. This is one of the clearest pieces of primary evidence that the upstream beneficiary of AI is “not just semiconductors.”
Vertiv reported Q1 2026 revenue of $2.65B and adjusted operating margin of 20.8%, with the Americas segment growing strongly on data-center demand. A separate release says extreme density, gigawatt-scale operations, and adaptive liquid cooling will shape data-center design going forward. Eaton announced support for >1MW rack densities and 35MW-class modular deployment, plus switchgear capacity expansion. Schneider Electric named data centers as the main driver of Q1 2026 Systems +16% and Energy Management +12.8%. Quanta Services is not a pure data-center play, but its Q1 2026 record total backlog of $48.5B suggests transmission, civil, and construction bottlenecks are becoming visible at the final stage of AI buildout.
Company-by-Company Summary
In the table below, “pricing power” and “supply constraint” are 5-point scores I assigned based on public information, with 5 being strongest. The scores themselves are hypotheses, but the basis for each is anchored to primary disclosures wherever possible.
How the scores are calibrated:
- Pricing power: how much room a company has to raise prices when demand is strong. 5 means “if demand is there, the company can raise prices freely” (closed model labs, the HBM oligopoly). 1 means “the company cannot push prices onto customers; pricing is cost-plus only” (labor-intensive service layers).
- Supply constraint: the time and physical ceiling involved in expanding supply once demand rises. The closer to the physical layer, the higher the score. Concrete reference points:
- 5: fab construction takes 3–5 years; HBM allocations are filled years out; gas turbine EPC takes 2–3 years; construction and permitting are chronically tight. Supply cannot be scaled up quickly when demand spikes.
- 4: strong constraint, but additional investment leaves some room to scale up
- 3: physical constraint exists but can be absorbed by equipment procurement or operational adjustments
- 2: layers without meaningful physical constraints internally (model labs, software layers — no internal physical bottleneck of their own)
The strongest investment opportunities tend to arise where both axes are high (HBM, TSMC advanced packaging, power equipment, etc.), which is the central argument of this piece.
| Company | Role | Pricing power | Supply constraint | Main risks | KPIs to watch |
|---|---|---|---|---|---|
| Anthropic | Top closed model, Agentic / Coding | 5 | 2 | Model competition, flat-rate adverse selection, inference-cost overruns | ARR, API revenue/MTok, output ratio, Enterprise seats |
| NVIDIA | GPUs, racks, networking, AI factories | 5 | 3 | Regulation, ASIC substitution, customer concentration | Data Center revenue, gross margin, Networking attach, Rubin ramp |
| CoreWeave | Neocloud, GPU capacity sales | 3 | 4 | Funding, debt, customer concentration | Revenue backlog, CapEx, utilization, Adjusted operating margin |
| Nebius | Neocloud, Rubin capacity | 3 | 4 | Capacity ramp, funding, contract execution | Backlog, ramp timing, ARR, equipment procurement |
| TSMC | Leading-edge logic, CoWoS / SoIC / CoPoS | 4 | 5 | Geopolitics, CapEx growth, yield | Leading-edge node mix, advanced packaging capacity, GM, CapEx |
| Micron Technology | HBM, SOCAMM, DRAM | 5 | 5 | Supply/demand reversal, qualification competition | HBM revenue mix, Cloud / Core DC margins, GM |
| Samsung Electronics | HBM4, SOCAMM2, DRAM/NAND | 5 | 5 | Mass-production yield, labor, price reversal | DS division operating profit, HBM4/SOCAMM2 ramp, contract horizons |
| SK hynix | HBM leader, DRAM | 5 | 5 | Customer concentration, intensifying competition | HBM mix, operating margin, supply contract horizons |
| ASML | EUV / DUV lithography | 4 | 5 | China regulation, customer CapEx volatility | Bookings, memory mix, EUV shipments |
| Applied Materials | Deposition / etch / inspection, HBM / advanced packaging | 4 | 4 | Front-end investment cycle, China dependence | Semi equipment growth, HBM / 3D packaging revenue |
| Lam Research | Etch / deposition, TSV / advanced packaging | 4 | 4 | Memory investment reversal | Advanced packaging revenue growth, CSBG |
| KLA | Inspection / metrology, packaging process control | 4 | 4 | Customer equipment-investment timing | Product / Service growth, Advanced packaging contribution |
| Tokyo Electron | Front-end equipment, HBM process, 3D integration | 4 | 4 | China regulation, WFE volatility | Revenue, HBM-related POR, advanced packaging revenue |
| ASE Technology | OSAT, advanced packaging / test | 3 | 4 | TSMC in-house mix, price pressure | Advanced packaging revenue, test ratio |
| Ibiden | ABF / high-performance substrates | 4 | 5 | Capacity ramp, customer concentration | CapEx, substrate utilization, layer-count pricing |
| GE Vernova | Turbines, transformers, grid equipment | 4 | 5 | Project delays, policy, weak wind | Backlog, DC equipment orders, GW slot reservations |
| Vertiv | Cooling, power, rack-adjacent | 4 | 4 | Competition, falling cooling intensity per W | Revenue growth, Adjusted operating margin, liquid-cooling mix |
| Eaton | Power distribution, switchgear, modular power | 4 | 5 | Supply chain, construction delays | Data center orders, switchgear capacity, prefab lead time |
| Schneider Electric | Distribution, cooling, prefab, DC systems | 4 | 4 | Macro, competition, project timing | EM growth, Systems growth, Data Center mix |
| Quanta Services | Transmission, construction, utility interconnect | 3 | 5 | Labor, permitting, construction delays | Backlog, Electric segment backlog, FCF |
Pricing Power vs Bottleneck Comparison
The next table separates “where it is easy to raise prices” from “where it is physically hard to add capacity”. Scores are again my estimates, but the axes are anchored to public information. The key takeaway is that the strongest investment opportunities tend to arise where pricing power and supply constraint are both present — not where only one is.
| Layer | Pricing power | Supply constraint | Comment |
|---|---|---|---|
| Closed model labs | 5 | 2 | Easy to capture WTP through high-quality agents. But physical supply constraint is mostly external. |
| NVIDIA system / rack / networking | 5 | 3 | Easy to take price across the system, but exposed to upstream constraints. |
| HBM / SOCAMM / high-performance DRAM | 5 | 5 | One of the strongest 2026 profit pools — both pricing and supply tightness are strong. |
| TSMC leading-edge nodes | 4 | 5 | Pricing rises gradually; supply cannot expand quickly. |
| TSMC / OSAT advanced packaging | 4 | 5 | The actual physical bottleneck for AI system expansion. |
| Equipment | 4 | 4 | Beneficiary of the second wave of AI investment, but with a customer CapEx lag. |
| Substrates / OSAT | 3 | 4 | Strong supply constraint, somewhat weaker bargaining power than front-end. |
| Neocloud | 3 | 4 | Very high growth, but pricing power depends on funding and supply secured. |
| Power / cooling / grid equipment | 4 | 5 | Long lead times and permitting — likely the real bottleneck from 2026. |
| Construction / utility interconnect | 2 | 5 | Limited pricing power, but capacity shortfalls tend to be chronic. |
Looking at the timeline, constraints through 2025 centered on GPUs, HBM, and CoWoS. From 2026 onward, HBM and advanced packaging stay tight, but the bottleneck is likely to migrate toward grid equipment, gas turbines, switchgear, liquid cooling, and construction. GE Vernova’s surging backlog and Eaton’s switchgear capacity expansion are leading indicators.
The table below organizes the bottleneck shift by period, with attribution. The 2026 row is essentially a summary of SemiAnalysis’s argument rather than my original organization. The 2026–2027 row is my own time-ordering of primary disclosures from GE Vernova, Eaton, Vertiv, and Quanta.
| Period | Main bottlenecks | Source / basis |
|---|---|---|
| 2023–2025 | GPU supply shortage, HBM ramp, CoWoS shortage | Each company’s earnings; broadly known in the industry |
| 2026 | Model value rises (Agentic AI), Rubin / SOCAMM expand the system BOM, HBM and advanced packaging stay over-demand | Direct summary of SemiAnalysis “AI Value Capture” |
| 2026–2027 | Power equipment, transformers, switchgear tighten; liquid cooling, prefab, construction become constraints; grid interconnection and gas turbine lead times become the bottleneck | Time-ordered from primary disclosures (GE Vernova, Eaton, Vertiv, Quanta) by the author |
Counterarguments, KPIs to Watch, and Open Questions
The largest counterargument is that model differentiation may not last. If open models improve, hyperscalers’ in-house ASICs scale, and abstraction layers grow at the application level, then pricing power for model labs and NVIDIA would compress. NVIDIA itself recorded a $4.5B inventory and purchase obligation charge on China-bound products — regulation risk cannot be ignored. Equipment is also exposed to China regulation and tariffs; Neoclouds depend on the funding environment. The cycle could break. SemiAnalysis itself argues that as long as closed frontier models maintain a clear edge in knowledge work and compute remains structurally short, lab pricing power persists. This piece leans toward that view, but it is not certain.
The second counterargument is that efficiency improvements may eat into infrastructure investment. This is half right and half wrong. Anthropic says the same job can be done better with model improvement, but also notes that token consumption can rise with higher inference effort. Eaton points to “load bursting” in AI clusters as a new power-quality issue that average power consumption alone cannot capture. Efficiency reduces rack count but at the same time raises utilization, peak load, and operational difficulty. In power, cooling, and networking, this “more quality than quantity” challenge becomes a new revenue source.
The third counterargument is that cooling stocks may be overheated and demand could weaken if next-generation chip efficiency improves. Reuters reported in early 2026 that cooling-related stocks dropped after Jensen Huang’s remarks. This is an important warning — expectations for liquid and high-density cooling may already be priced in. But Vertiv subsequently reaffirmed the need for extreme density and liquid cooling, so it is more realistic to read this as “the content of needed cooling changes” rather than as a demand collapse.
KPIs to watch from here are clear:
- Model labs: revenue per task, Enterprise seat growth, output token ratio, share of long-running agent usage on usage-based pricing
- NVIDIA: Data Center gross margin, Networking revenue, Rubin ramp, rack ASP, Spectrum-X penetration
- TSMC: advanced packaging capacity, leading-edge revenue mix, CapEx allocation, through-cycle margin
- Memory: how many years out HBM allocations are filled, HBM4 / 4E qualification status, SOCAMM rack counts
- Equipment: HBM / advanced packaging revenue disclosure, book-to-bill, service revenue
- Power: GE Vernova’s data-center orders, turbine slot reservations, Eaton / Schneider’s data-center contribution, Vertiv’s liquid-cooling-related growth, Quanta’s Electric backlog
Open questions remain. How much SOCAMM actually moves NVIDIA’s margin in the Rubin generation cannot be measured precisely from outside. SemiAnalysis’s claim of SN5610 price discrimination toward Neoclouds is also hard to verify independently from primary sources. Private model labs like Anthropic and OpenAI do not disclose true gross margins, retention rates, or usage-based mix. Monthly capacity for CoWoS / SoIC / CoPoS and HBM / SOCAMM vendor share are also disclosed only partially. The strongest convictions in this piece are therefore in upstream physical constraints and disclosed margin improvement. Separating “how much is pricing strategy” from “how much is excess demand” at the model labs and NVIDIA still carries uncertainty.
Conclusion
The answer this piece reaches is straightforward. The hypothesis “Agentic AI raises token economic value → model-lab margins rise → NVIDIA captures more across the system → that value propagates into TSMC, HBM, advanced packaging, equipment, power, and cooling” is partially established as of spring 2026. It is not yet a completed cycle, but at least in memory, advanced packaging, and power, the expansion of the profit pool is already visible in primary data.
In investor terms, the AI theme in 2026 is no longer “which company touches AI demand?” It has shifted to “which company can directly price high-value AI workflows, or which company holds the most non-substitutable scarce resource needed to deliver them?” The first set is model labs and NVIDIA. The second set is HBM, advanced packaging, leading-edge foundry, and grid / power equipment / cooling / construction. Neoclouds sit between them as a large option, but with the highest financial risk.
In one sentence: AI is shifting from “an industry that sells compute” to “an industry that sells finished work.” Value concentrates in companies that can price that finished work directly, and in the most-scarce layer that physically supports it. SemiAnalysis captured the first half (the value shift toward model labs, plus the under-extracted value at NVIDIA / TSMC). What this piece argues as its own contribution is that the second half — upstream propagation through memory, wafers, packaging, and power — has already begun.
Sources
Primary disclosures and public materials
- SemiAnalysis: https://newsletter.semianalysis.com/p/ai-value-capture-the-shift-to-model
- Anthropic Claude pricing: https://platform.claude.com/docs/en/about-claude/pricing
- Anthropic Claude Opus 4.7 release notes: https://www.anthropic.com/news/claude-opus-4-7
- OpenAI Codex: https://openai.com/codex/
- Google Gemini Code Assist: https://docs.cloud.google.com/gemini/docs/codeassist/overview
- NVIDIA Q4/FY2026 results: https://nvidianews.nvidia.com/news/nvidia-announces-financial-results-for-fourth-quarter-and-fiscal-2026
- NVIDIA 10-K: https://www.sec.gov/Archives/edgar/data/1045810/000104581026000021/nvda-20260125.htm
- NVIDIA Spectrum-X: https://www.nvidia.com/en-us/networking/spectrumx/
- TSMC 20-F (2025): https://investor.tsmc.com/sites/ir/sec-filings/2025_20F%20Report.pdf
- TSMC 1Q26 transcript: https://investor.tsmc.com/chinese/encrypt/files/encrypt_file/reports/2026-04/3cef85204275f94fd111485cfdf4adb3c0263c45/TSMC%201Q26%20Transcript.pdf
- Micron FY26 Q2 results: https://investors.micron.com/news-releases/news-release-details/micron-technology-inc-reports-results-second-quarter-fiscal-2026
- Micron data center memory: https://www.micron.com/products/memory/data-center-memory
- Samsung Q1 2026 results: https://news.samsung.com/global/samsung-electronics-announces-first-quarter-2026-results
- Reuters on SK hynix Q1: https://www.reuters.com/world/asia-pacific/nvidia-supplier-sk-hynix-q1-profit-rises-406-meets-forecasts-2026-04-22/
- CoreWeave Q4 2025 results: https://investors.coreweave.com/news/news-details/2026/CoreWeave-Reports-Strong-Fourth-Quarter-and-Fiscal-Year-2025-Results/
- CoreWeave March 2026 investor presentation: https://s205.q4cdn.com/133937190/files/doc_presentations/2026/Mar/02/March-2026-Investor-Presentation.pdf
- Nebius–Meta agreement: https://nebius.com/newsroom/nebius-signs-new-ai-infrastructure-agreement-with-meta
- Reuters on Jane Street / CoreWeave: https://www.reuters.com/legal/transactional/jane-street-signs-6-billion-ai-cloud-deal-with-coreweave-boosts-stake-2026-04-15/
- ASML 2025 annual report: https://www.sec.gov/Archives/edgar/data/937966/000162828026011377/asml-2025xannualxreportx.htm
- Applied Materials investor materials: https://ir.appliedmaterials.com/static-files/8beb86c0-2533-4d20-ba09-41fab41fc451
- Lam Research March-Q26 slides: https://investor.lamresearch.com/image/MarQ26_slides_Full_Final.pdf
- KLA FY2026 Q3 results: https://ir.kla.com/news-events/press-releases/detail/514/kla-corporation-reports-fiscal-2026-third-quarter-results
- KLA on packaging pivot: https://www.kla.com/advance/innovation/the-packaging-pivot-driving-ai-chip-performance
- Tokyo Electron FY26 Q4 transcript: https://www.tel.com/ir/library/report/pjuomj00000000tf-att/fy26q4transcript-e.pdf
- Reuters on ASE: https://www.reuters.com/world/asia-pacific/taiwans-ase-expects-strong-demand-boost-advanced-chip-packaging-sales-2026-2026-04-29/
- Ibiden capital investment: https://www.ibiden.com/company/2026/02/notice-regarding-capital-investment-plan-for-high-performance-ic-package-substrates.html
- GE Vernova Q1 2026 release: https://www.gevernova.com/news/press-releases/ge-vernova-reports-first-quarter-2026-financial
- GE Vernova Q1 2026 webcast: https://www.gevernova.com/sites/default/files/gev_webcast_pressrelease_04222026.pdf
- Vertiv Q1 2026 release: https://investors.vertiv.com/news/news-details/2026/Vertiv-Reports-Strong-First-Quarter-with-Diluted-EPS-Growth-of-136-Adjusted-Diluted-EPS-Growth-of-83-Raises-Full-Year-Guidance/default.aspx
- Vertiv on liquid cooling outlook: https://investors.vertiv.com/news/news-details/2026/Vertiv-Expects-Powering-Up-for-AI-Digital-Twins-and-Adaptive-Liquid-Cooling-to-Shape-Data-Center-Design-and-Operations/default.aspx
- Eaton 2026 data center outlook: https://www.eaton.com/us/en-us/company/news-insights/blog/blog-data-centers-market-outlook-2026-eaton.html
- Eaton modular data center expansion: https://www.eaton.com/us/en-us/company/news-insights/news-releases/2026/eaton-expands-modular-data-center-offering.html
- Eaton Nebraska expansion: https://www.eaton.com/us/en-us/company/news-insights/news-releases/2026/eaton-expands-operations-in-nebraska-with-new-manufacturing-facility.html
- Schneider Electric Q1 2026 release: https://www.se.com/ww/en/assets/pdf/release-q1-revenues-2026
- Schneider Electric IR: https://www.se.com/ww/en/about-us/investor-relations/financial-results/
- Quanta Services Q1 2026 results: https://www.prnewswire.com/news-releases/quanta-services-reports-first-quarter-2026-results-302758147.html
- Reuters on cooling stocks reaction: https://www.reuters.com/business/data-center-cooling-related-stocks-drop-after-nvidia-ceo-huangs-comments-2026-01-06/
Internal Causal Model (reference)
- Investment-theme causal model (proprietary, non-public) — used as the source for the four subgraphs (semiconductor value chain and data-center power cascade) and the 18 triples
Join the conversation on LinkedIn — share your thoughts and comments.
Discuss on LinkedIn