Nishiki — More Results at Less Cost: An Open-Source Tool for Maximizing AI's Return
View on GitHubChallenge
Enterprise AI costs keep growing, but teams on the ground only look at the token bill — the cost. Switching to a cheaper model because it is expensive lowers quality, and results fall with it, so the cost per unit of result actually gets worse. Fundamentally, there is no unit in the world for measuring what value a given token produced.
Solution
I set a policy of measuring AI's return in value rather than money (VOI: Value on Investment), and distilled it into a computable unit (KOI: KPI on Investment = KPI achieved ÷ cost). I then built Nishiki, an open-source tool that measures and maximizes KOI on real data. It parses an existing agent's source read-only, auto-detects the KPI, swaps models in runtime memory only, runs an exhaustive real-data comparison, and shows the cheapest path that does not sacrifice quality — all on a single browser page.
Result
On a lightweight extraction task, Nishiki found a path that delivers 84% of a frontier model's quality at roughly 1/117 of the cost — about 100x the quality per dollar (KOI). On a financial reconciliation agent in real operation (Bedrock, 50 items), it found a path that keeps quality at or above the current setup while cutting cost by 73% and improving KOI by 3.8–4.3x. In all cases the agent's source is unmodified and read-only, and no charges are incurred until an explicit approval.
Introduction — What KOI and Nishiki Are
The unit introduced in this project, KOI (KPI on Investment), measures the value AI produces as “result per dollar.” It has just one formula.
Just as ROI expresses “return on investment,” KOI expresses “KPI achieved on investment (= cost).” My view is that the Return an AI produces should be measured not by revenue or token count, but by KPI (result) — and I turned that view directly into a unit.
Nishiki is the open-source tool that measures and maximizes this KOI on existing AI agents using real data. I built it to solve one specific problem I kept running into while helping build AI agents in consulting work. Below, I explain that problem first, in order.
Why Looking Only at Cost Leads to Failure
The trigger was a problem I kept facing every time I built an AI agent. When a company is worried about its AI inference cost, the savings measures I can propose usually come down to five: route to a cheaper model, tighten the prompt to make it shorter, restrict usage itself, stop using AI, or negotiate a discount with the provider. Every one of them, however, is the flip side of the field making decisions by looking at cost alone.
A typical failure unfolds like this.
flowchart LR
    A["Shocked by the<br/>token bill"] --> B["Switch to a<br/>cheaper model"]
    B --> C["Accuracy drops"]
    C --> D["The result (KPI)<br/>drops with it"]
    D --> E["Cost per result<br/>actually gets worse"]
You switch to a cheaper model to cut cost, and the cost per unit of result gets worse instead. The outcome is the opposite of the intent.
What matters here is that the thing to maximize is the ratio of result to cost, not cheapness of cost on its own. Halving the cost while quality falls to 60% actually lowers the result per dollar. Conversely, cutting cost to a quarter while keeping quality means the same dollar produces 4x the result. What you should watch is the ratio “result ÷ cost.”
But this runs into a new wall: how do you count that “result”?
AI Has No Unit of Horsepower
Around the time I was carrying this same concern in the field, two articles caught my eye that named the problem from a different angle.
One was an article by semianalysis, a media outlet that specializes in analyzing the semiconductor and AI infrastructure landscape. Its argument was this: the Industrial Revolution had a unit — horsepower — and precisely because of it, you could compare “how much of a human’s or a horse’s labor this machine replaces” and make an investment decision.
AI has no equivalent of horsepower. The same one million tokens could be meaningless text, could be the summary of an important email, or could support a decision that shapes corporate strategy. Economic value cannot be measured by token count — it is determined by what the tokens produced. — semianalysis, “AI Dark Output: The Visible Cost of AI’s Invisible Output”
The other was a move by Microsoft. Around the same time, Azure added a feature called Azure ROI, which shows in real time how much the model you are using actually costs. It shares the concern that token volume is squeezing corporate budgets. But what Azure ROI visualizes is only the actual cost of running the model. It does not yet answer “what did that cost produce?”
In other words, even a major player like Microsoft can only visualize as far as the cost. No one yet holds a unit for the value that cost produced. Put differently: the idea of cutting cost has spread, yet there is no mechanism or tool that answers what the field really wants to know — what value that cost produced. This missing piece was exactly the problem I wanted to solve.
VOI — A Policy of Measuring in Value
So I worked out a concept to address this problem: VOI (Value on Investment). It refers to a policy of understanding AI’s return through “value” rather than monetary ROI. Just as the Industrial Revolution had horsepower as a yardstick, I believe the AI era needs a yardstick for value too.
VOI is a policy (what to aim for). But simply saying “measure value” does not translate into concrete action. So I organized it into three layers.
flowchart TD
    VOI["VOI — what to aim for<br/>Policy: measure in value, not money"]
    KOI["KOI — how to measure<br/>Unit: KPI ÷ cost"]
    NISHIKI["Nishiki — what to measure with<br/>Tool: measure candidate models,<br/>pick the best for the KPI"]
VOI --> KOI --> NISHIKI- VOI = what to aim for (a value yardstick to replace horsepower)
- KOI = how to measure (the first implementation of VOI as a formula = KPI ÷ cost)
- Nishiki = what to measure with (a tool that measures candidate models on real data and picks the best one for the KPI)
Bring the abstraction of “value” down to a computable unit, then all the way to a working tool. This project is the story of those three layers.
KOI — Turning VOI Into a Computable Unit
KOI is given several properties so it works in practice.
- It only covers what can be measured. KPI is limited to things that can be quantified — reconciliation accuracy, extraction F1, agreement rate with a human’s final judgment. Work for which no scoring mechanism can be built is out of scope for KOI. It does not call something valuable when that value cannot be checked with numbers.
- A quality floor. Raw KOI (= KPI ÷ cost) inflates as cost approaches zero, so a “free but low-quality” model can appear to rank first. So I set a required quality line (a floor) and disqualify any candidate that falls below it. Among the candidates above the floor, the cheapest path wins — this is the heart of KOI.
Mapped onto the ROI formula, the AI era is a state where everyone measures I (Investment = cost) but no one measures R (Return). KOI is what you get by placing KPI in that R. If what Azure showed is I (cost), then KOI is a redefinition of R (return) as KPI.
What Nishiki Does
Nishiki is what measures KOI on an actual agent using real data. If you already have an AI agent calling models, Nishiki answers the questions leadership really wants to ask: which model gives the most quality per dollar, and how much cheaper can you go without lowering quality?
It starts from a single command. An orchestrator AI asks just a few questions, and then proceeds automatically.
cd /path/to/your/agent
nishiki
flowchart LR
A["Launch nishiki"] --> B["Read source,<br/>auto-detect KPI"]
B --> C["Propose models<br/>across price tiers"]
C --> D["Free dry run<br/>→ cost gate"]
D --> E["Measure → KOI table<br/>(browser)"]- Read the source and auto-detect the KPI — find the chokepoint where the code calls a model, read whether it is “label classification” or “extraction/generation,” and automatically pick the scoring function (agreement rate / span F1, etc.). No manual scoring setup required.
- Propose models by price tier — line up candidates spanning from ultra-cheap to frontier (OpenRouter / Bedrock).
- Free dry run → cost gate — present an estimate before charging. Nothing is billed until you approve.
- Measure → KOI table — see KOI, cost, and latency at a glance on a browser dashboard. Move the quality-floor slider and the cheapest path that meets that quality re-sorts instantly.
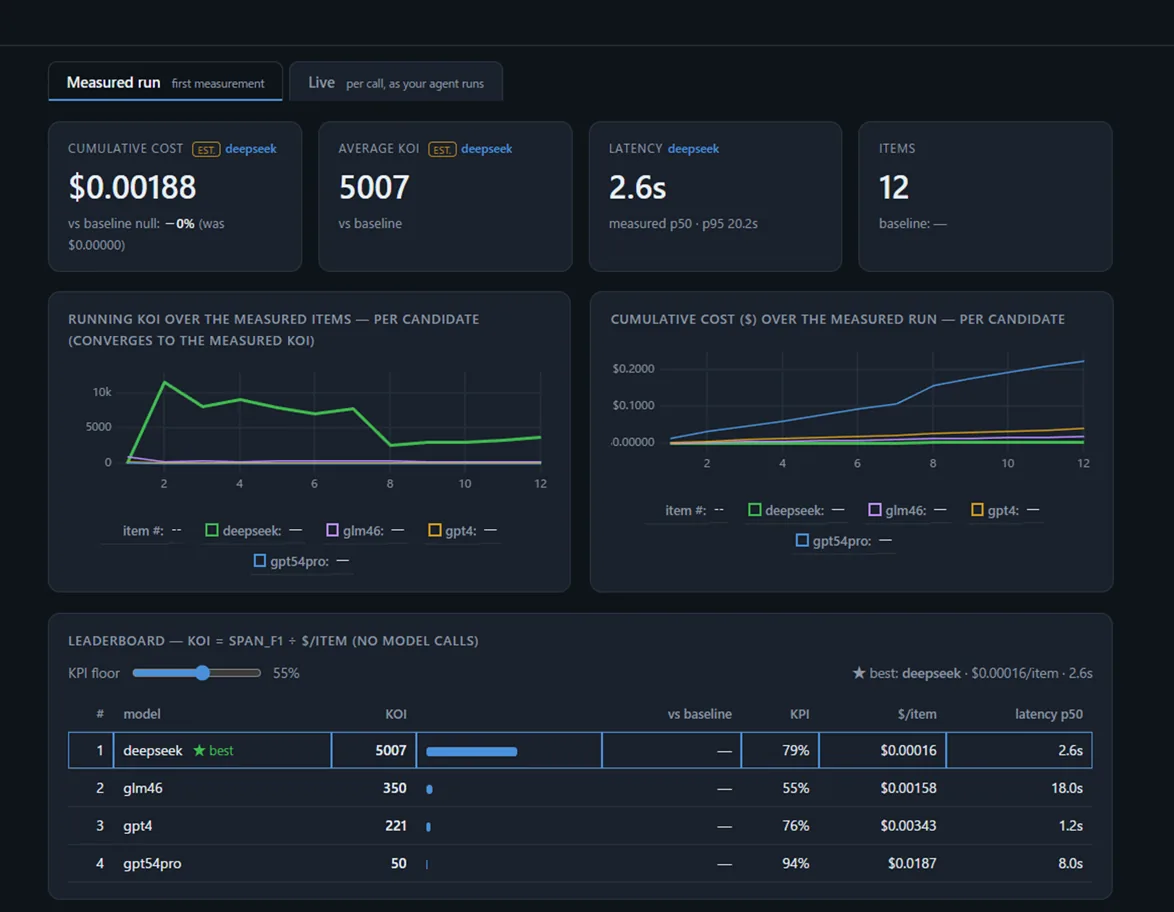
The first-measurement dashboard: cards for KOI / cost / latency, a trend chart per candidate, and a leaderboard with a KPI-floor slider. Without knowing the formula or the model names, you can see the best path per dollar at a glance.
What matters just as much is that it is visible in real time during development. While your agent runs alongside it, Nishiki shows the KOI of each call without calling any model (it just computes token count × unit price locally). As you change prompts and execution paths, you can watch how cost and KOI move on the spot. It is a device for making “look at KOI before you run” a habit.
Example 1 — Lightweight and Self-Contained: Span Extraction
First, a small example anyone can try in a few minutes to show KOI at work. The agent takes a short passage and a question, and returns the fragment of the passage that answers it verbatim — no paraphrase. For instance, asked “which ocean does the Amazon River empty into?”, it returns the words “the Atlantic Ocean” straight out of the text.
You do not tell Nishiki how to grade it. Nishiki reads the agent’s source, sees that the task extracts a fragment of text rather than choosing from a fixed set of labels, and automatically picks the matching scorer — span F1 (how much the returned text overlaps the correct answer, measured 0–1). The quality floor (the minimum a model must reach) is set to 0.55.
With this setup, here are the results of measuring 4 models × 12 questions (KOI = KPI ÷ cost).
| Model | KPI (span F1) | $ / item | KOI | Where it stands |
|---|---|---|---|---|
| deepseek | 0.79 | $0.00016 | 5007 | Above floor, ultra-cheap = best value |
| glm-4.6 | 0.55 | $0.00158 | 350 | Just above the floor |
| gpt-4 | 0.76 | $0.00343 | 221 | Middle of the pack |
| gpt-5.4-pro (frontier) | 0.94 | $0.01872 | 50 | Highest quality, lowest value |
On quality alone, the frontier model is the best (F1 0.94). But by KOI it ranks last, at 50. Meanwhile deepseek delivers 84% of the frontier’s quality (F1 0.79) at roughly 1/117 of the cost, so its KOI is 5007 — about 100x the frontier’s. In other words, KOI captures in a single number not quality or cost alone but “how much result you get per dollar,” and points straight to the most cost-effective model. That is why the leaderboard above ranks every model by KOI. Note that because KOI grows as cost falls, without a quality floor an ultra-cheap model returning poor output would appear to rank first — so any model below the floor (here F1 0.55) is dropped from the candidates.
You can check this result directly on the dashboard (the leaderboard with deepseek on top). Running cd samples/span_extract && nishiki koi-report --web opens the same screen with no keys and no charges.
Example 2 — In the Field: A Financial Document Reconciliation Agent
The same framework can be applied directly to business AI agents as well. Here I share the result of running Nishiki on a “financial document reconciliation AI agent” on Bedrock that I actually operate (it reads documents and decides OK / needs review), with client-specific information withheld. The KPI is agreement rate with the human’s final judgment, measured on 50 items.
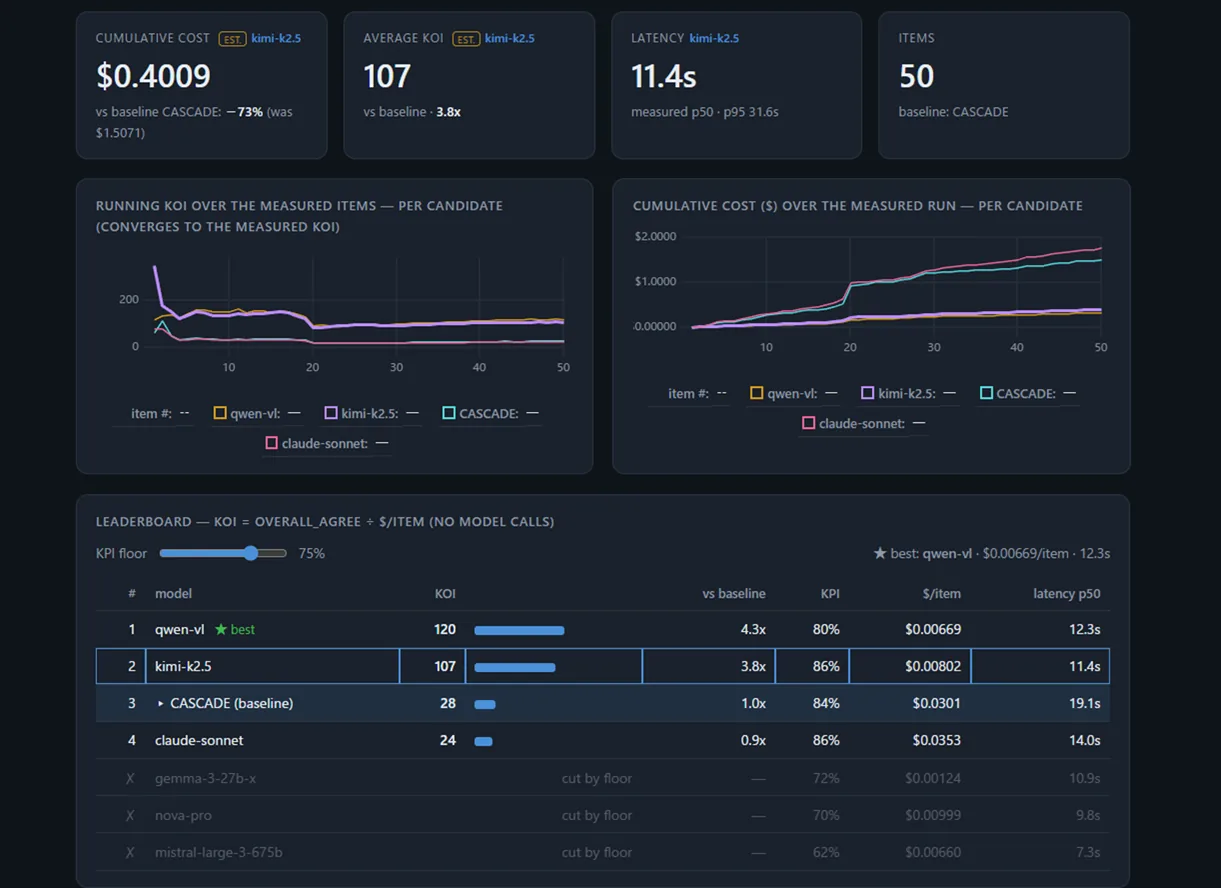
The first measurement of the financial reconciliation agent. Candidate models are measured exhaustively against the current setup (CASCADE) as the baseline. The quality floor is 75%.
The result was clear. The current CASCADE setup (a multi-stage combination of several models) stays at KOI 28. Against that, the candidate models came out ahead as follows.
- qwen-vl: KPI 80% (above floor) at KOI 120 = 4.3x the current setup. $0.0301 → $0.00669 per item.
- kimi-k2.5: KPI 86% (higher quality than current) at KOI 107 = 3.8x.
- Cumulative cost goes from $1.5071 → $0.4009 (−73%). Holding the quality line, cost drops to nearly a quarter.
- Meanwhile gemma / nova / mistral, which fell below the 75% floor, are automatically disqualified (grayed out in the lower rows). KOI correctly rejects candidates that are “cheap but insufficient in quality.”
Because the KOI framework is domain-independent, classification or non-classification, lightweight or enterprise, it all lands in the same single table.
Design Principles — What Nishiki Upholds
Before flashiness, I prioritized being trustworthy as a tool.
- Read-only. It never modifies the target agent’s code, database, or data. Model swaps happen in runtime memory only, so you can apply it directly to a production setup.
- Charges only after explicit approval. First it validates the wiring (load → prompt → parse → score) in a free dry run, then presents an estimate at the cost gate. Nothing is billed until you approve.
- Two phases: calibration → static operation. It measures once on real data to establish a baseline, then runs statically thereafter. “Needing to run and measure” is not a defect — it is an intended calibration step.
- Leadership only needs to look at one number: KOI. Without knowing the formula or the model names, a glance at KOI tells you whether the current setup is the best choice, how much cheaper you can go at the same quality, and how much higher quality you can reach at the same cost.
What Nishiki Aims For
With a metric like KOI, you can capture AI’s return on investment easily. Making “look at KOI before you run” a habit — that is the doorway where I want to place Nishiki.
What Still Needs Work
Let me note the current limitations honestly.
- KOI can only measure KPIs for which a scoring function can be written — reconciliation accuracy, extraction F1, agreement with human judgment, and so on. Work whose “value” can only be stated qualitatively cannot be measured by KOI today.
- Scoring the KPI sometimes requires a human. If the AI grades its own output, the same system both produces and scores the result, so that KPI cannot be trusted. The AI only speeds the work up with draft provisional labels; a human guarantees the final ground truth.
- Cost is computed at each candidate’s API list price. It is a fair basis for comparing “what it would cost if you switched,” and does not necessarily match what was actually paid in a given experiment.
I state these limitations openly, up front, rather than hiding them. KOI is not an all-purpose “value meter.” It is a unit for measuring what can be measured, honestly, in a comparable form.
Conclusion
AI’s cost is now visible to anyone. But a unit for measuring the value that cost produced does not yet exist in the world. To fill that gap, I prepared a policy called VOI, a unit called KOI, and a tool called Nishiki.
The goal is a shift from “cut the cost” to “get more result from the same dollar.” Nishiki is the first tool for that.
Try It
Nishiki is released as open source (Apache-2.0). The repository is here.
https://github.com/matu79go/nishiki
pip install git+https://github.com/matu79go/nishiki.git
cd nishiki/samples/span_extract
nishiki koi-report --web        # opens the dashboard above, no keys and no charges
Appendix
On the Name
The first name was KPC (KPI per Cost). Faithful to the formula, but hard to say. So I leaned into how easily it associates. ROI is the most universally understood business metric. Replace its R with K (KPI) and “an AI-era ROI” gets across with no explanation. Hence KOI (KPI on Investment). Its being a homophone of “koi” (carp) is used here as a hook — a carp swimming up the river of cost and transforming into results, the image of the dragon gate. The tool’s name Nishiki (nishikigoi, brocaded carp) comes from there too.
Measurement Environment and Sources
- Measurements were run against candidate models on OpenRouter / Amazon Bedrock. Prices are each provider’s list price (obtained via
nishiki models). - The lightweight sample data is 12 questions I wrote to be domain-neutral (copyright-free). The business example is a production agent on Bedrock (client information undisclosed).
- Repository: https://github.com/matu79go/nishiki (Apache-2.0).
- Background articles: semianalysis (the argument that AI has no equivalent of horsepower), and Microsoft’s Azure ROI (real-time visualization of a model’s actual cost — cost only, with no measure of the value produced).
Join the conversation on LinkedIn — share your thoughts and comments.
Discuss on LinkedIn